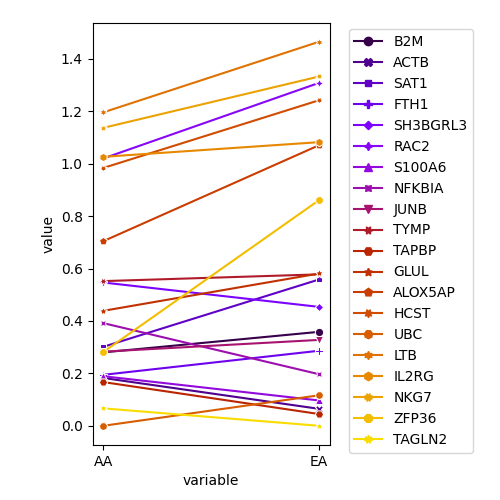
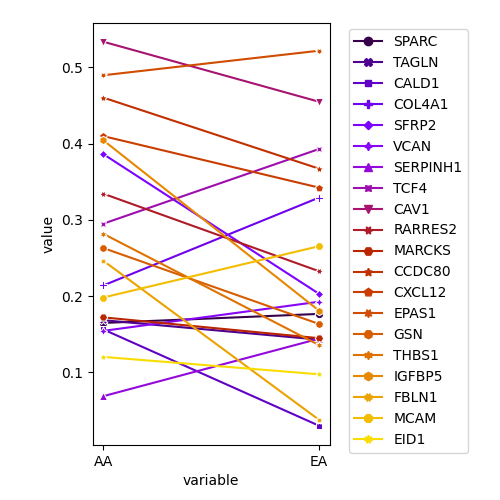
plot.select.expr.2.EA
import sys
import os
import re
import numpy as np
import scipy
import scipy.stats
import matplotlib
import matplotlib.pyplot as plt
import seaborn as sns
import pandas as pd
from sklearn.decomposition import PCA
from sklearn.utils.extmath import randomized_svd
from sklearn.manifold import TSNE
from scipy.stats import pearsonr
sys.setrecursionlimit(10000)
from sklearn import svm
from sklearn.calibration import CalibratedClassifierCV
from scipy.stats import ttest_ind, ttest_rel
from operator import itemgetter
import pick_genes_by_total

def read_column(n):
	f = open(n)
	f.readline()
	gx = {}
	for l in f:
		l = l.rstrip("\n")
		ll = l.split("\t")
		for ix,v in enumerate(ll):
			if v=="": continue
			gx.setdefault(ix, [])
			gx[ix].append(v)
	f.close()
	return gx

def read_gsm(n):
	f = open("%s" % n)
	by_query = {}
	q = None
	queries = []
	for l in f:
		l = l.rstrip("\n")
		if l.startswith("Query"):
			q = l.split(" ", 1)[1]
			queries.append(q)
			by_query.setdefault(q, [])
			continue
		ll = l.split()
		g = ll[0]
		pval1 = float(ll[1])
		pval2 = float(ll[2])
		avgexpr_h = float(ll[3])
		avgexpr_l = float(ll[4])
		a_mean = float(ll[5])
		a_std = float(ll[6])
		#if pval1<1e-5 and pval2<1e-5: #EA
		if pval1<0.05 and pval2<0.05: #AA
		#if pval1<0.1 and pval2<0.1:
			#by_query[q].append((g, pval1, pval2, avgexpr_h))
			#by_query[q].append((g, pval1, pval2, avgexpr_h/avgexpr_l))
			#by_query[q].append((g, pval1, pval2, np.log(avgexpr_h/avgexpr_l))) #EA
			by_query[q].append((g, pval1, pval2, np.log(avgexpr_h/a_mean))) #mean, test #AA
			#by_query[q].append((g, pval1, pval2, (avgexpr_h - a_mean)/a_std))
			#by_query[q].append((g, pval1, pval2, avgexpr_h - a_mean)) #AA
			#by_query[q].append((g, pval1, pval2, avgexpr_h / a_std))

	f.close()
	return by_query, queries

def read_list(n):
	m = []
	f = open(n)
	for l in f:
		l = l.rstrip("\n")
		m.append(l)
	f.close()
	return m

def is_not_filtered(g):
	if g.startswith("RPL") or g.startswith("RPS") or g.startswith("HLA-"):
		return False
	else:
		return True

def is_not_gene(g, choice, qid):
	if choice=="EA":
		if qid==2:
			if g=="PTPRC" or g=="CORO1A" or g=="CD52":
				return False
			return True
		return True
	elif choice=="AA":
		if qid==1:
			if g=="GNG11" or g=="RGS5" or g=="TPM1":
				return False
			return True
		return True
if __name__=="__main__":
	choice = sys.argv[2] #EA or AA
	_, _, _, gene_sum = pick_genes_by_total.read("cell.type.expr.M%s.%s.more.joined.txt" % (sys.argv[1], choice), choice)
	#g,g_CAF,g_T,g_Myeloid,g_Neutrophil, g_T+g_Neutrophil


	if choice=="EA":
		#gene_sum.sort(key=itemgetter(1), reverse=True)
		#genes_AA = set([g[0] for g in gene_sum[:15]])
		gene_sum.sort(key=itemgetter(5), reverse=True)
		#gene_sum = [g for g in gene_sum if g[0] not in genes_AA]
	else:
		gene_sum.sort(key=itemgetter(5), reverse=True)
		genes_EA = set([g[0] for g in gene_sum[:50]])
		gene_sum.sort(key=itemgetter(1), reverse=True)
		gene_sum = [g for g in gene_sum if g[0] not in genes_EA]

	qid = int(sys.argv[1])

	'''
	if choice=="EA":
		gene_sum.sort(key=itemgetter(5), reverse=True)
	else:
		gene_sum.sort(key=itemgetter(1), reverse=True)
	'''
	#g_of_interest = [g[0] for g in gene_sum[:100]]


	g_of_interest = [g[0] for g in gene_sum if is_not_filtered(g[0]) and is_not_gene(g[0], choice, qid)]
	g_of_interest = g_of_interest[:20] #AA, :40 works.
	#g_of_interest = g_of_interest[:20]

	#columns = read_column("EAcoef.filtered.list")
	EA = read_list("EA.list")
	#AA = read_list("AA.list.2")
	AA = read_list("AA.list")
	EA_list = {}
	AA_list = {}
	queries = []
	for sample in EA:
		EA_list[sample], queries = read_gsm(sample)
	for sample in AA:
		AA_list[sample], queries = read_gsm(sample)

	#print(queries)
	#sys.exit(0)

	#genes_x = read_list(sys.argv[1])
	#genes_x = read_list("selected.by.expr.q%s.EA.more.txt" % sys.argv[1])
	#genes_x = read_list("selected.by.expr.q%s.EA.more.with.neutro.txt" % sys.argv[1])

	#genes_x = columns[qid-1]
	genes_x = g_of_interest
	EA_higher = 0
	AA_higher = 0
	equal = 0
	by_gene = {}


	t_table = {}
	t_id = 0

	ax_EA = []
	ax_AA = []
	for ix,q in enumerate(queries):
		#print("Query:", q)
		by_gene_EA = {}
		for sample in EA:
			for g, i, j, a in EA_list[sample][q]:
				by_gene_EA.setdefault(g, {})
				#by_gene_EA[g].setdefault(sample, 0)
				by_gene_EA[g][sample] = a
		by_gene_AA = {}
		for sample in AA:
			for g, i, j, a in AA_list[sample][q]:
				by_gene_AA.setdefault(g, {})
				#by_gene_AA[g].setdefault(sample, 0)
				by_gene_AA[g][sample] = a

		if ix == qid-1:
			for ggid, g in enumerate(genes_x):
				sam_EA = []
				sam_AA = []
				for s in EA:
					if g not in by_gene_EA or s not in by_gene_EA[g]:
						sam_EA.append(0)
						#sam_EA.append(1.0)
					else:
						sam_EA.append(by_gene_EA[g][s])
				for s in AA:
					if g not in by_gene_AA or s not in by_gene_AA[g]:
						sam_AA.append(0)
						#sam_AA.append(1.0)
					else:
						sam_AA.append(by_gene_AA[g][s])

				'''
				for sE, sA in zip(sam_EA, sam_AA):
					t_table[t_id] = [g, sA, sE]
					t_id+=1
				'''
				#sam_EA = [by_gene_EA[g][s] for s in EA]
				#sam_AA = [by_gene_AA[g][s] for s in AA]

				#sam_AA[:4]
				avg_AA = np.mean(sam_AA)
				avg_EA = np.mean(sam_EA)
				sys.stdout.write(g + "\t" + str(avg_AA) + "\t" + str(avg_EA) + "\t" + str(avg_AA-avg_EA) + "\n")
				#sys.stdout.write(g + "\t" + "\t".join(["%.2f" % x for x in sam_AA]) + "\t" + "\t".join(["%.2f" % x for x in sam_EA]) + "\n")
				if avg_EA > avg_AA:
					EA_higher+=1
				elif avg_AA > avg_EA:
					AA_higher+=1
				else:
					equal+=1
				#t_table[ggid] = [g, np.exp(avg_AA), np.exp(avg_EA)]
				t_table[ggid] = [g, avg_AA, avg_EA]

				exp_AA = np.exp(avg_AA)
				exp_EA = np.exp(avg_EA)
				#ax_AA.append(exp_AA)
				#ax_EA.append(exp_EA)
				ax_AA.append(avg_AA)
				ax_EA.append(avg_EA)
				#ax_diff.append(exp_EA - exp_AA)

	print(AA_higher, EA_higher, equal)
	print(ttest_rel(ax_AA, ax_EA, alternative="less"))

	df = pd.DataFrame.from_dict(t_table, orient="index", columns=["gene", "AA", "EA"])

	dx = pd.melt(df, id_vars=["gene"], value_vars=["AA", "EA"])
	plt.figure(figsize=(5,5))
	plt.subplots_adjust(left=0.185, right=0.66, bottom=0.11, top=0.955, hspace=0.2, wspace=0.2)
	sns.lineplot(data=dx, x="variable", y="value", hue="gene", ci=None, dashes=False, palette="gnuplot", markers=True, style="gene") #ci = None
	plt.legend(bbox_to_anchor=(1.05,1), loc=2)
	#plt.show()
	#plt.savefig("lineplot_%s_q%d.png" % (choice, qid))
	plt.savefig("lineplot_expr_z_%s_q%d.png" % (choice, qid))
	#sys.exit(0)

	'''
		genes = set(list(by_gene_EA.keys()) + list(by_gene_AA.keys()))
		gs = []
		for g in genes:
			#print(q, g, by_gene_EA.get(g, 0), by_gene_AA.get(g, 0))
			count_EA = by_gene_EA.get(g, 0)
			count_AA = by_gene_AA.get(g, 0)
			size_ratio = len(AA) / len(EA)

			if count_EA==0:
				ratio = count_AA / len(AA) / (1/(len(EA)*2))
				score = ratio * (1.0 * size_ratio +count_AA) / 2
			else:
				ratio = count_AA/ len(AA)  / (count_EA / len(EA))
				score = ratio * (count_EA * size_ratio +count_AA) / 2

			if ratio>1.2 and count_AA/len(AA) >= 0.5:
			#if ratio<1.2 and ratio>1 and count_AA/len(AA) >= 0.5:
				gs.append((g, ratio, score, count_EA, count_AA))
		gs.sort(key=itemgetter(2), reverse=True)
		for g,c1,c2,c3,c4 in gs:
			if g in genes_x:
				#print(g, c1, c2, c3, c4)
				by_gene.setdefault(g, {})
				by_gene[g][ix] = c1
	'''

	'''
		fw = open("q%d.shared2.more.txt" % (ix+1), "w")
		for g,c1,c2,c3,c4 in gs:
			fw.write(g + "\n")
		fw.close()
	'''

	for g in genes_x:
		if g not in by_gene: continue
		sys.stdout.write(g + "\t")
		for ix in range(9):
			sys.stdout.write(str(by_gene[g].setdefault(ix, 0)) + "\t")
		sys.stdout.write("\n")
Running Command
python3 plot.select.2.EA.py AA 1python3 plot.select.2.EA.py EA 2Results