visualize.AA.cluster.fig2d
from smfishHmrf.HMRFInstance import HMRFInstance
from smfishHmrf.DatasetMatrix import DatasetMatrix, DatasetMatrixSingleField, DatasetMatrixMultiField
from smfishHmrf.spatial import rank_transform_matrix, calc_silhouette_per_gene
import sys
import math
import numpy as np
import scipy
import scipy.stats
from scipy.stats import zscore
from scipy.spatial.distance import euclidean, squareform, pdist
import smfishHmrf.reader as reader
import pandas as pd
import matplotlib as mpl
import matplotlib.pyplot as plt
import seaborn as sns
from matplotlib.lines import Line2D
from smfishHmrf.bias_correction import calc_bias_moving, do_pca, plot_pca
from scipy.cluster.vq import kmeans2
def norm_centroid(cent):
scale_factor = 2000/4
cent[:,0] = (cent[:,0] - float(1000)) / float(500)
cent[:,1] = (cent[:,1] - float(-1000)) / float(500)
return cent
def read_centroid(n):
f = open(n)
f.readline()
num_cell = 0
for l in f:
l = l.rstrip("\n")
num_cell+=1
f.close()
Xcen = np.empty((num_cell, 2), dtype="float32")
field = np.empty((num_cell), dtype="int32")
f = open(n)
f.readline()
ind = 0
for l in f:
l = l.rstrip("\n")
ll = l.split(",")
Xcen[ind,:] = [float(ll[-2]), float(ll[-1])]
field[ind] = int(ll[0])
ind+=1
f.close()
return Xcen, field
def read_position(n):
f = open(n)
f.readline()
Xcen = {}
order = []
for l in f:
l = l.rstrip("\n")
ll = l.split("\t")
x,y = float(ll[1]), float(ll[2])
t_id = ll[0]
Xcen[t_id] = (x,y)
order.append(t_id)
f.close()
cen = np.empty((len(order), 2), dtype="float32")
for i in range(len(order)):
cen[i,:] = Xcen[order[i]]
field = []
for i in range(len(order)):
t_id = order[i]
t_field = "_".join(t_id.split("_")[:2])
tt = t_field
field.append(tt)
field = np.array(field)
return cen, field
def read_cluster(n, cluster_label):
f = open(cluster_label)
m = []
for l in f:
l = l.rstrip("\n")
m.append(l)
f.close()
map_label = {}
for im,v in enumerate(m):
map_label[im+1] = v
f = open(n)
clust = []
for l in f:
l = l.rstrip("\n")
clust.append(map_label[int(l)])
f.close()
return np.array(clust)
'''
def read_metadata(n):
f = open(n)
h = f.readline().rstrip("\n").split("\t")
meta = {}
for l in f:
l = l.rstrip("\n")
ll = l.split("\t")
t_zip = dict(zip(h, ll[1:]))
t_id = t_zip["cell_ID"]
meta.setdefault("cell_ID",[])
meta["cell_ID"].append(t_id)
for i in ["0", "0.5", "1", "1.5", "2", "2.5", "3", "3.5", "4"]:
for j in ["10", "20", "30"]:
t_key = "hmrf_k.%s_b.%s" % (j, i)
tt = int(t_zip[t_key])
meta.setdefault(t_key, [])
meta[t_key].append(tt)
meta.setdefault("leiden_clus", [])
meta["leiden_clus"].append(int(t_zip["leiden_clus"]))
f.close()
for k in meta:
meta[k] = np.array(meta[k])
return meta
'''
def convert(n, vmin, vmax):
return (n - vmin) / (vmax - vmin + 1)
if __name__=="__main__":
Xcen, field = read_position("Xcen_v0_TNBC_race_reprocessed.txt")
#Xcen, field = read_position("Xcen.txt")
#meta = read_metadata("frequency.kmeans")
clust = read_cluster("frequency.kmeans.k20iter10000.1", "cell.cell.interact/uniq.clusters")
#clust = read_cluster("frequency.leiden")
#max_clust = np.max(clust)
print(clust)
uniq_field = np.unique(field)
print(uniq_field)
print(len(uniq_field))
#sys.exit(0)
dot_size = 35
ncol = 5
nrow = int(10 / ncol)
size_factor = 5
if 10%ncol>0:
nrow+=1
print(nrow, ncol)
f, axn = plt.subplots(nrow, ncol, figsize=(ncol * size_factor, nrow * size_factor))
plt.subplots_adjust(hspace=0.05, wspace=0.05)
ct = 0
#print(uniq_field)
#sys.exit(0)
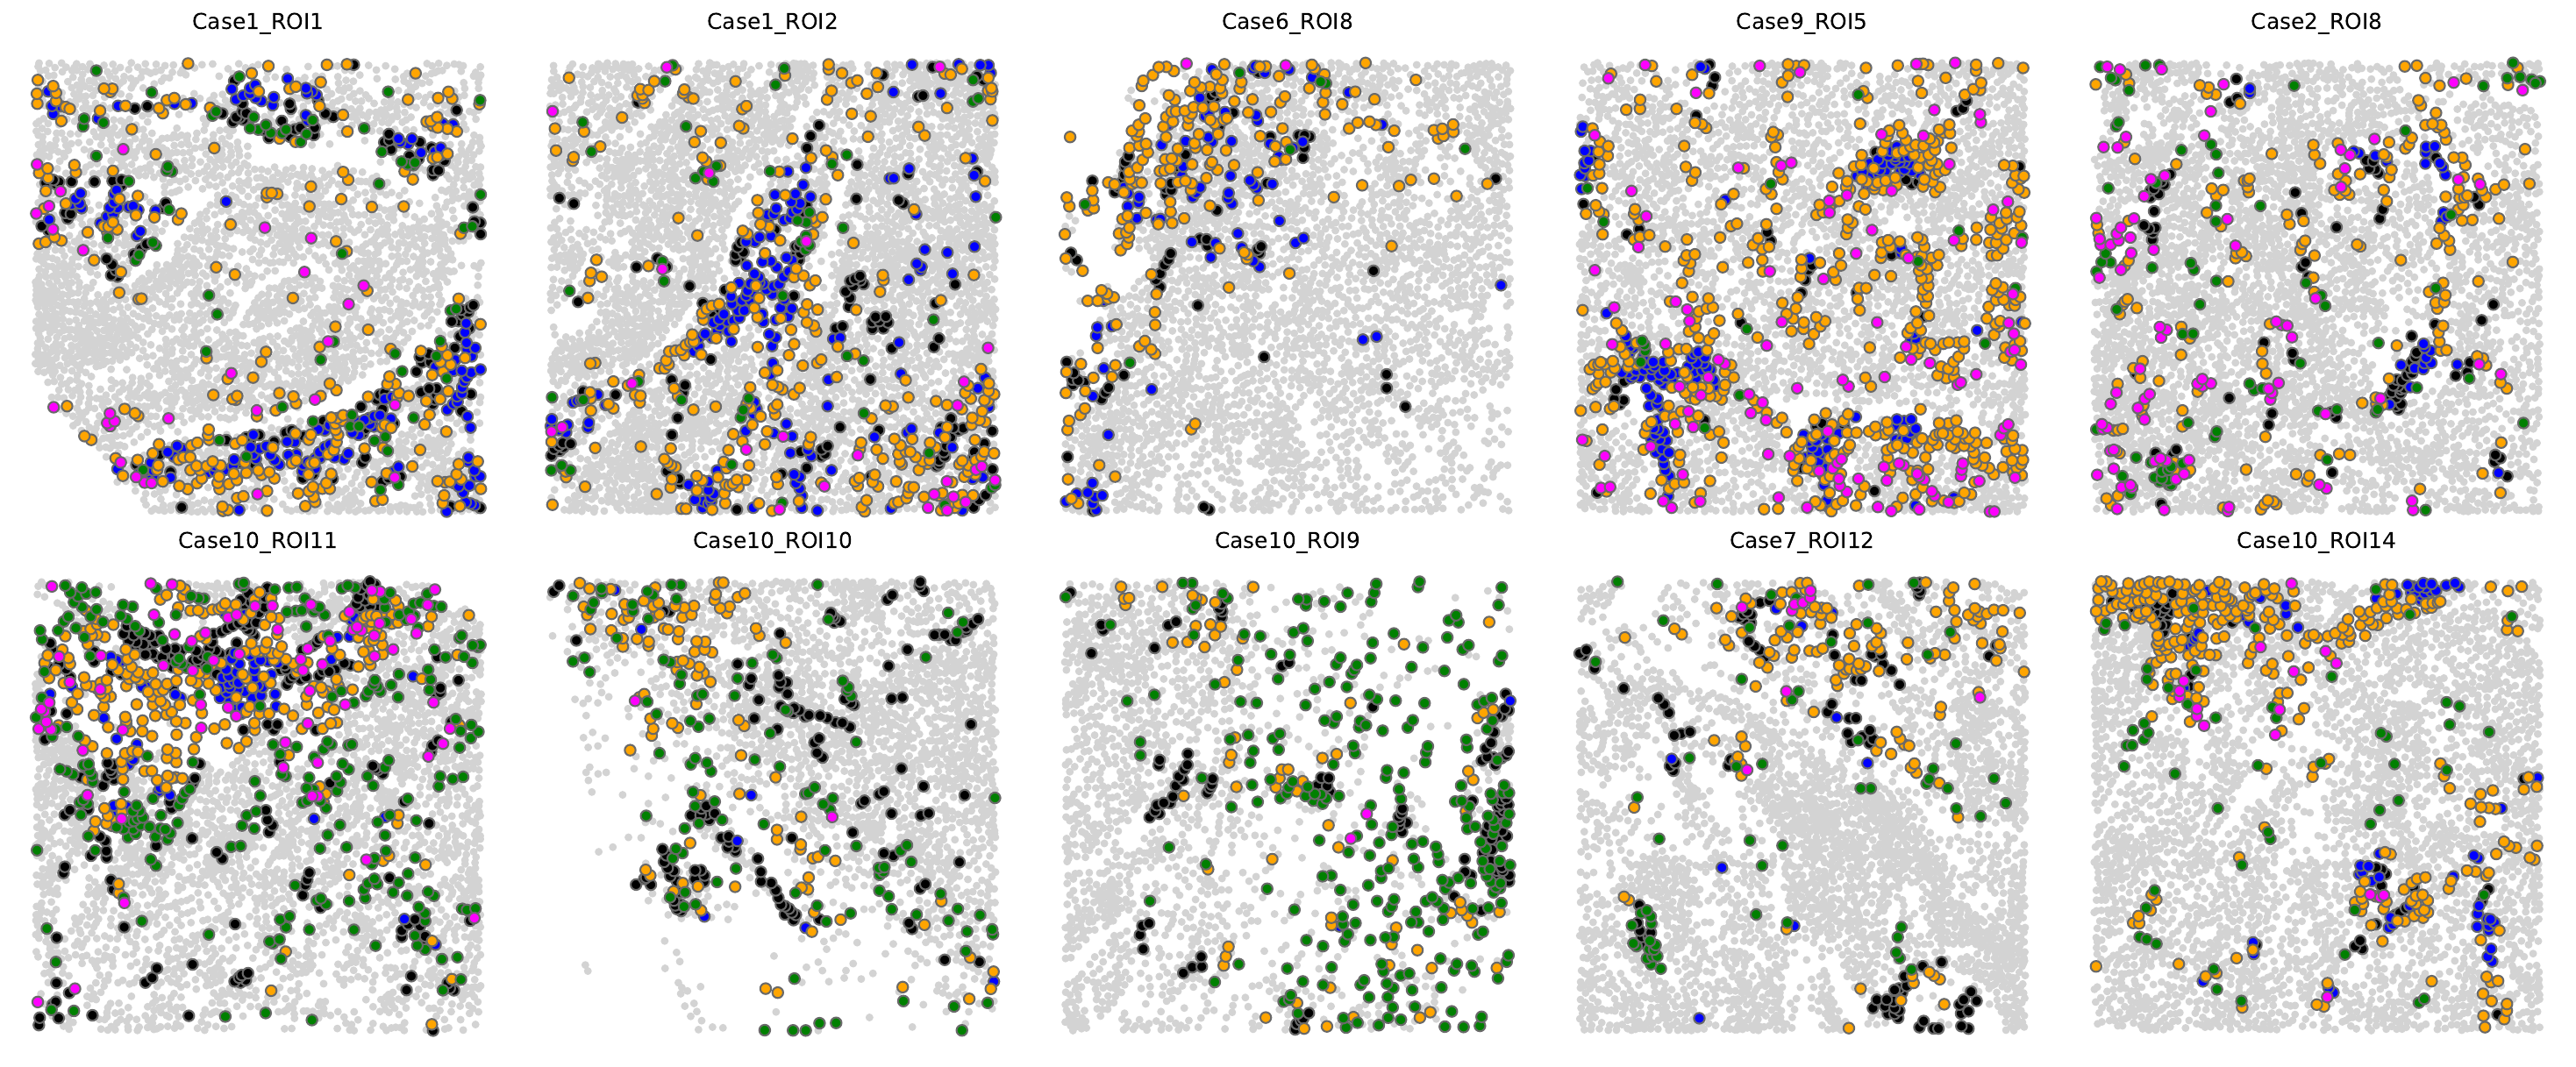
uniq_field = ["Case1_ROI1", "Case1_ROI2", "Case6_ROI8", "Case9_ROI5", "Case2_ROI8", \
"Case10_ROI11", "Case10_ROI10", "Case10_ROI9", "Case7_ROI12", "Case10_ROI14"]
#uniq_field = ["Case10_ROI8", "Case10_ROI9", "Case7_ROI12", "Case7_ROI13", "Case10_ROI10", "Case10_ROI11", "Case7_ROI10", "Case8_ROI6", "Case10_ROI13", "Case10_ROI14"]
#uniq_field = ["Case1_Bone", "Case1_Breast", "Case2_Bone", "Case2_Breast"]
'''
uniq_field = ['Case1_Bone_ROI1', 'Case1_Bone_ROI2', 'Case1_Bone_ROI3', 'Case1_Bone_ROI4',
'Case1_Bone_ROI5', 'Case1_Breast_ROI1', 'Case1_Breast_ROI2',
'Case1_Breast_ROI3', 'Case1_Breast_ROI4', 'Case1_Breast_ROI5',
'Case2_Bone_ROI1', 'Case2_Bone_ROI2', 'Case2_Bone_ROI3', 'Case2_Bone_ROI4',
'Case2_Bone_ROI5', 'Case2_Breast_ROI1', 'Case2_Breast_ROI2']
'''
c1 = "13 CD31 Vimentin AR"
c2 = "19 PLK1 PD1"
c3 = "20 CD31 CD45RA"
c4 = "12 CD16 CD163 CD68"
c5 = "4 Vimentin AR PDL1 PLK1"
c6 = "10 CD68"
#c7 = "15 CD4 CD3"
for fd in uniq_field:
#m = np.where(field==fd)[0]
#m = np.where((field==fd) & ((clust==1) | (clust==8) | (clust==7) | (clust==2) | (clust==5) | (clust==13) | (clust==14) | (clust==6) | (clust==15)))[0]
#m = np.where((field==fd) & ((clust==13) | (clust==14) | (clust==15)))[0]
m = np.where((field==fd) & (clust==c1))[0]
#m2 = np.where((field==fd) & (clust==c2))[0]
m3 = np.where((field==fd) & (clust==c3))[0]
m4 = np.where((field==fd) & (clust==c4))[0]
m5 = np.where((field==fd) & (clust==c5))[0]
m6 = np.where((field==fd) & (clust==c6))[0]
#m7 = np.where((field==fd) & (clust==c7))[0]
m8 = np.where((field==fd) & ((clust!=c1) & (clust!=c3) & (clust!=c4) & (clust!=c5) & (clust!=c6)))[0]
#m8 = np.where((field==fd) & ((clust!=c1) & (clust!=c2) & (clust!=c3) & (clust!=c4) & (clust!=c5) & (clust!=c6) &(clust!=c7)))[0]
#print(fd, m)
#print(fd, m2)
#cl = meta["leiden_clus"]
#cl = meta["hmrf_k.20_b.1"]
#colors = np.empty(m.shape, dtype="int32")
#for c in range(colors.shape[0]):
# colors[c] = 1
axn.flat[ct].scatter(Xcen[m8,0], Xcen[m8,1], s=dot_size*0.3, c="lightgray", edgecolors=None, cmap="RdYlBu", vmin=1, vmax=1) #other
axn.flat[ct].scatter(Xcen[m,0], Xcen[m,1], s=dot_size, c="black", edgecolors="dimgray", cmap="RdYlBu", vmin=1, vmax=1) #cd31 vimentin
#axn.flat[ct].scatter(Xcen[m2,0], Xcen[m2,1], s=dot_size, c="darkgray", edgecolors="dimgray", cmap="RdYlBu", vmin=1, vmax=1) #plk1 pd1
axn.flat[ct].scatter(Xcen[m3,0], Xcen[m3,1], s=dot_size, c="blue", edgecolors="dimgray", cmap="RdYlBu", vmin=1, vmax=1) #cd31 cd45ra
axn.flat[ct].scatter(Xcen[m4,0], Xcen[m4,1], s=dot_size, c="orange", edgecolors="dimgray", cmap="RdYlBu", vmin=1, vmax=1) #cd16 cd163
axn.flat[ct].scatter(Xcen[m5,0], Xcen[m5,1], s=dot_size, c="green", edgecolors="dimgray", cmap="RdYlBu", vmin=1, vmax=1) #vimentin, ar
axn.flat[ct].scatter(Xcen[m6,0], Xcen[m6,1], s=dot_size, c="magenta", edgecolors="dimgray", cmap="RdYlBu", vmin=1, vmax=1) #cd68
#axn.flat[ct].scatter(Xcen[m7,0], Xcen[m7,1], s=dot_size, c="orange", edgecolors="dimgray", cmap="RdYlBu", vmin=1, vmax=1)
axn.flat[ct].title.set_text(fd)
#axn.flat[ct].title.set_visible(False)
axn.flat[ct].set_facecolor("white")
axn.flat[ct].axis("off")
ct+=1
#f.savefig("visual.clusters.pdf",bbox_inches='tight')
f.savefig("visual.AAclusters.fig2d.pdf",bbox_inches='tight')
#f.savefig("visual.clusters.pdf")
#plt.show()
sys.exit(0)
Running Command
python3 visualize.AA.cluster.fig2d.pyResults